Contents
Gaussian basis plot
Subscript to plot the data from the simulation of DFG for spatially confined CW fields.
ticPlot = tic;
FontSize = 18;

if(setting.Plot==true | any(setting.Plot==1)==true)
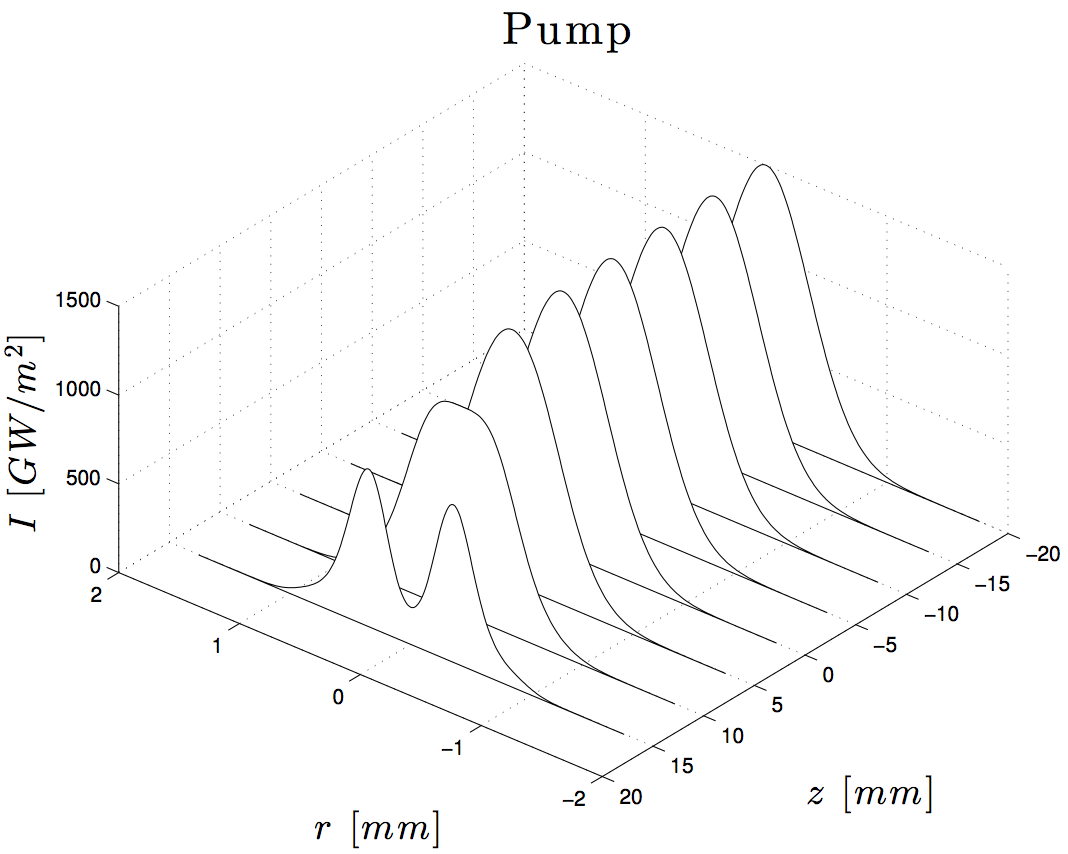
    figure(1)
    w1 = waterfall (raxis(1:10:end),zmili(1:floor(Param.zsteps/8):Param.zsteps),Pump.Iplot(1:floor(Param.zsteps/8):Param.zsteps,1:10:end).*1e-9);
    title('Pump','Interpreter','latex','FontSize',FontSize+4);
    xlabel('$r~[mm]$','Interpreter','latex','FontSize',FontSize);
    ylabel('$z~[mm]$','Interpreter','latex','FontSize',FontSize);
    zlabel('$I~[GW/m^2]$','Interpreter','latex','FontSize',FontSize);
    set(w1,'edgecolor','k');
    view([40+180 50]);
    if(setting.SaveFigure == true)
        export_fig(['PropergationIpump-Area' int2str(omega0pumpmicro*1e6) 'mumI' int2str(Pump.I0*1e-9) 'GW'], '-pdf', '-transparent');
    end
end

if(setting.Plot==true | any(setting.Plot==2))
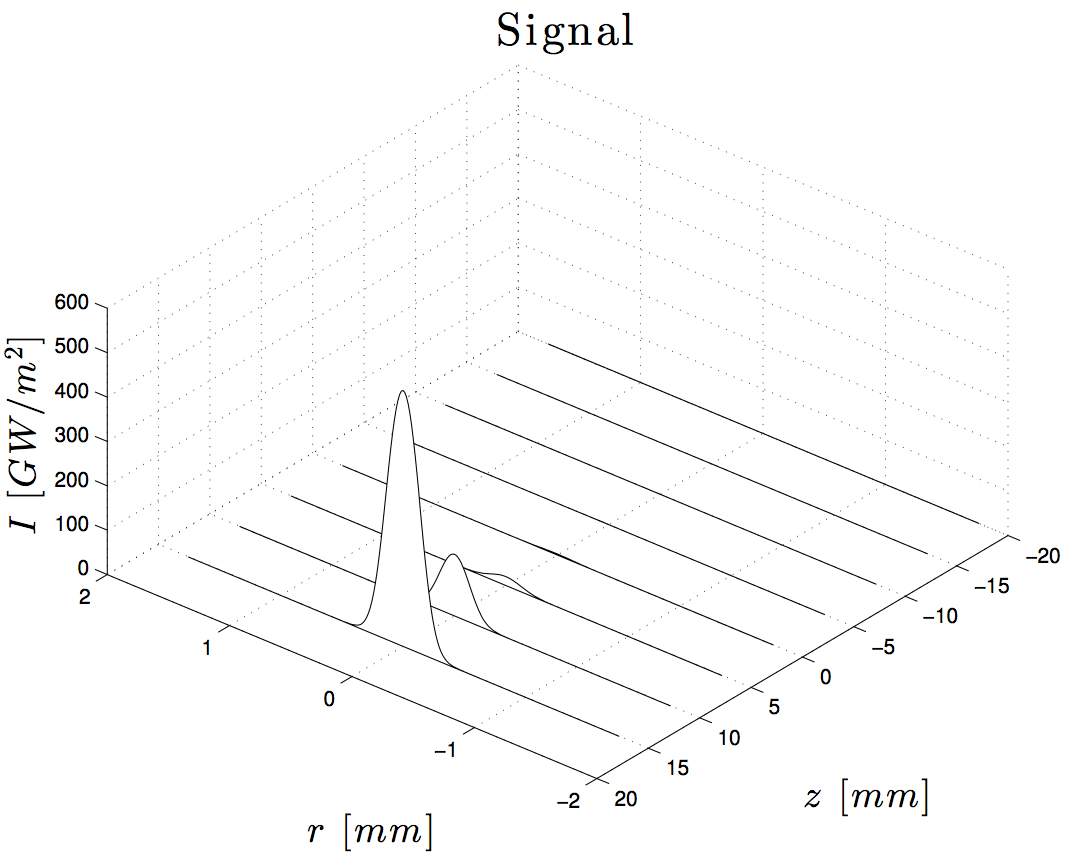
    figure(2)
    w2 = waterfall (raxis(1:10:end),zmili(1:floor(Param.zsteps/8):Param.zsteps),Signal.Iplot(1:floor(Param.zsteps/8):Param.zsteps,1:10:end).*1e-9);
    title('Signal','Interpreter','latex','FontSize',FontSize+4);
    xlabel('$r~[mm]$','Interpreter','latex','FontSize',FontSize);
    ylabel('$z~[mm]$','Interpreter','latex','FontSize',FontSize);
    zlabel('$I~[GW/m^2]$','Interpreter','latex','FontSize',FontSize);
    set(w2,'edgecolor','k');
    view([40+180 50])
    if(setting.SaveFigure == true)
        export_fig(['PropergationIsignal-Area' int2str(omega0pumpmicro*1e6) 'mumI' int2str(Pump.I0*1e-9) 'GW'], '-pdf', '-transparent');
    end
end

if(setting.Plot==true | any(setting.Plot==3))
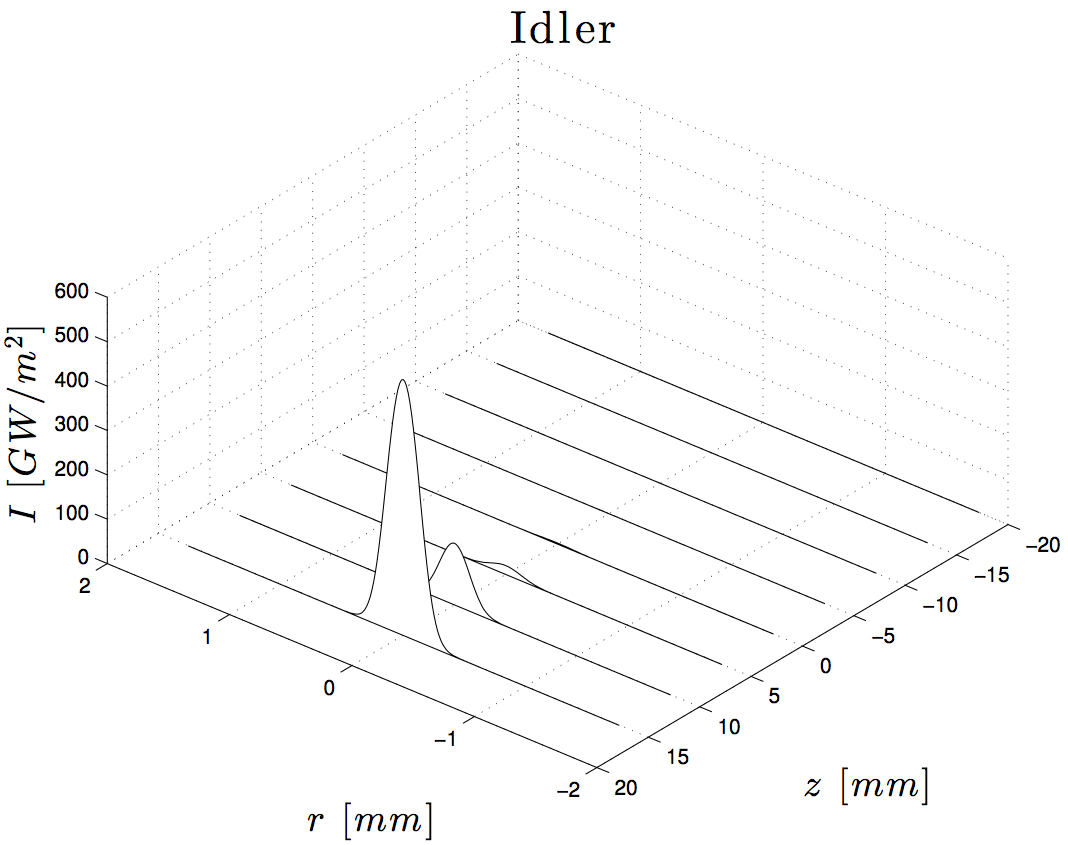
    figure(3)
    w3 = waterfall (raxis(1:10:end),zmili(1:floor(Param.zsteps/8):Param.zsteps),Signal.Iplot(1:floor(Param.zsteps/8):Param.zsteps,1:10:end).*1e-9);
    title('Idler','Interpreter','latex','FontSize',FontSize+4);
    xlabel('$r~[mm]$','Interpreter','latex','FontSize',FontSize);
    ylabel('$z~[mm]$','Interpreter','latex','FontSize',FontSize);
    zlabel('$I~[GW/m^2]$','Interpreter','latex','FontSize',FontSize);
    set(w3,'edgecolor','k');
    view([40+180 50])
    if(setting.SaveFigure == true)
        export_fig(['PropergationIidler-Area' int2str(omega0pumpmicro*1e6) 'mumI' int2str(Pump.I0*1e-9) 'GW'], '-pdf', '-transparent');
    end
end

if(setting.Plot==true | any(setting.Plot==4))
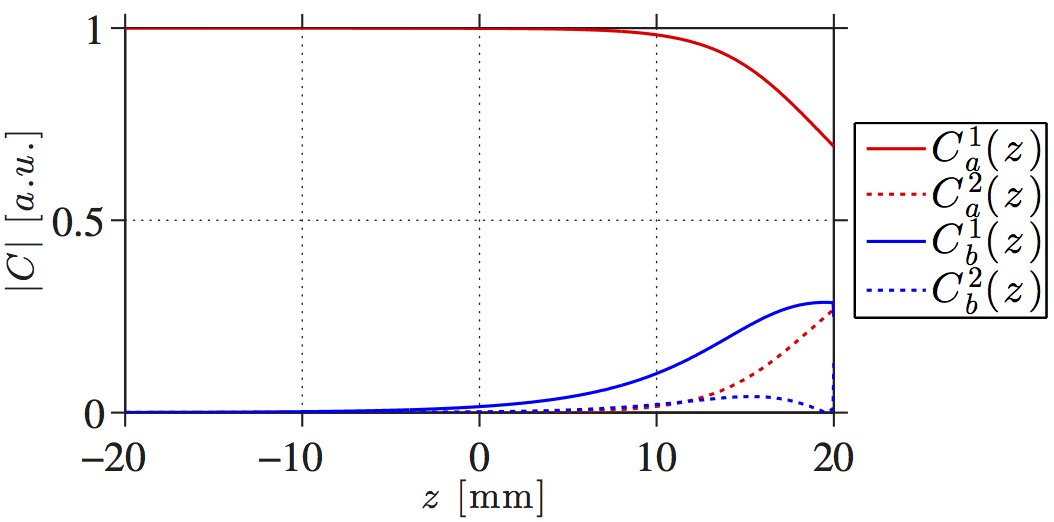
    figure(4)
    p41 = plot(zmili,abs(Pump.C(1,:))./abs(Pump.C(1,1)),'-r');
    hold on;
    p42 = plot(zmili,abs(Pump.C(2,:))./abs(Pump.C(1,1)),':r');
    p43 = plot(zmili,abs(Signal.C(1,:))./abs(Pump.C(1,1)),'-b');
    p44 = plot(zmili,abs(Signal.C(2,:))./abs(Pump.C(1,1)),':b');
    hold off;
    set([p41 p42 p43 p44],'LineWidth',1.5);
    l4 = legend('$C_a^1 (z)$','$C_a^2 (z)$','$C_b^1 (z)$','$C_b^2 (z)$','Orientation','vertical','Location','EastOutside');
    set(l4,'Interpreter','latex')
    PlotSetAxisLabels('$z$ [mm]','$|C|~[a.u.]$',FontSize);
    PlotSetFigureDimensions(0,2+10,20,10,0,0,0,0);
    PlotSetAxisProperties(5,3,20);
    set(gca, 'Units', 'normalized','Position', [0.15 0.22 0.6 0.65]);
    set(gca, 'Color', 'none'); % Sets axes background
    if(setting.SaveFigure == true)
        export_fig(['PropergationC12-Area' int2str(omega0pumpmicro*1e6) 'mumI' int2str(Pump.I0*1e-9) 'GW'], '-pdf', '-transparent');
    end
end

if(setting.Plot==true | any(setting.Plot==5))
    figure(5)
%     p51 = plot(zmili,Pump.FWHM(:,1),'-r');
%     hold on;
%     p52 = plot(zmili,Signal.FWHM(:,1),'-b');
%     hold off;
%    set([p51 p52],'LineWidth',1.5);
%    l5 = legend('$FWHM_a$','$FWHM_b$','Orientation','vertical','Location','EastOutside');
%    set(l5,'Interpreter','latex')
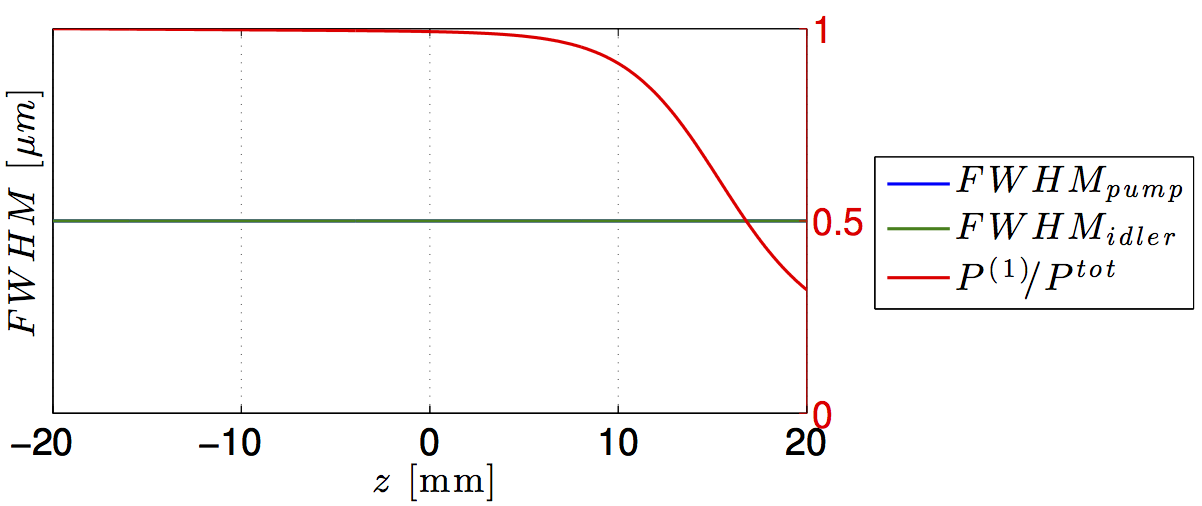
    [AX5,H51,H52] = plotyy(zmili,[Pump.FWHM(:,1),Idler.FWHM(:,1)].*1e3,zmili,abs(Pump.C(1,:))./sum(abs(Pump.C),1));
    set([H51;H52],'LineWidth',1.5);
    l5 = legend([H51;H52],'$FWHM_{pump}\,\,$','$FWHM_{idler}\,\,$','$P^{(1)}/P^{tot}$','Orientation','vertical','Location','EastOutside');
    set(l5,'Interpreter','latex');
    set(l5, 'Position', [0.73, 0.4, .25, .25])
    set(AX5,'FontSize', 18);
    set(AX5(2),'Ylim',[20,80]);
    set(AX5(1),'YTick',[20,50,80]);
    set(AX5(2),'Ylim',[0,1]);
    set(AX5(2),'YTick',[0,0.5,1]);
    grid on;
    PlotSetAxisLabels('$z$ [mm]','$FWHM~[\mu m]$',FontSize);
    PlotSetFigureDimensions(12,2+10,22,10,0,0,0,0);
 %   PlotSetAxisProperties(5,3,20);
    set(gca, 'Units', 'normalized','Position', [0.1 0.22 0.58 0.65]);
    set(gca, 'Color', 'none'); % Sets axes background
    if(setting.SaveFigure == true)
        export_fig(['PropergationFWHM-Area' int2str(omega0pumpmicro*1e6) 'mumI' int2str(Pump.I0*1e-9) 'GW'], '-pdf', '-transparent');
    end
end
if(setting.Plot==true | any(setting.Plot==6))
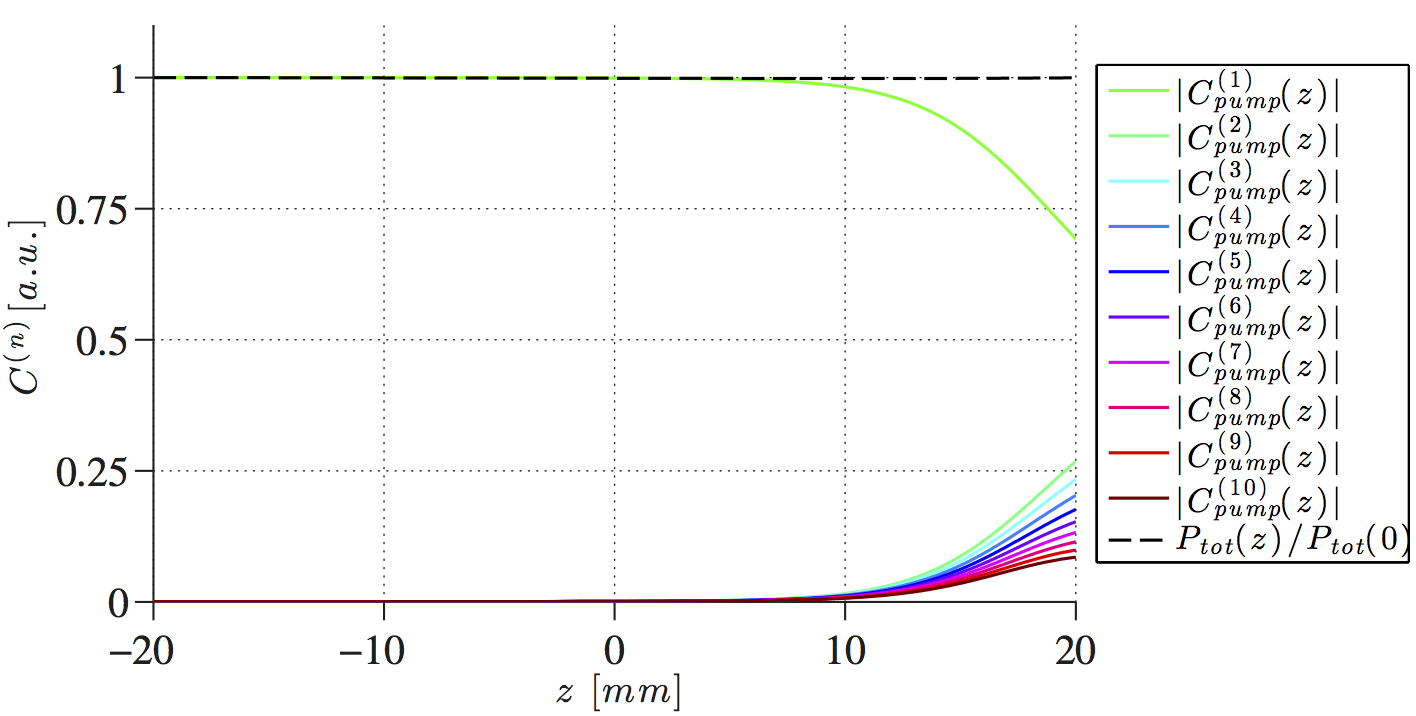
    figure(6)
    ColorSet=varycolor(Param.Lmax+1);
    legends6 = cell(1,Param.Lmax+1);
    hold on
    for l=1:Param.Lmax
        plot(zmili,abs(Pump.C(l,:))./abs(Pump.C(1,1)),'LineWidth',1.5,'Color',ColorSet(l,:));
        legends6{l} = ['$|C_{pump}^{(' num2str(l) ')}\,(z)|$'];
    end
        plot(zmili,Power(:)./Power(1),'--k','LineWidth',1.5,'Color',ColorSet(Param.Lmax+1,:));
        legends6{Param.Lmax+1} = '$P_{tot\,}(z)/P_{tot\,}(0)\,\,$';
        %test = sum((abs(Pump.n*Pump.C(:,:)).^2 + abs(Signal.n*Signal.C(:,:)).^2.)./(abs(Pump.n*Pump.C(1,1).^2)+abs(Signal.n*Signal.C(1,1).^2)),1);
        %plot(zmili,test,'LineWidth',1.5,'Color',ColorSet(Param.Lmax+2,:));
        %legends6{Param.Lmax+2} = '$C^2_{tot\,}(z)/C^2_{tot\,}(0)\,\,$';
    hold off;
    xlim([zmili(1) zmili(end)]);
    ylim([0 1.1]);
    l6 = legend(legends6,'Orientation','vertical','Location','EastOutside','FontSize',16);
    set(l6,'Interpreter','latex')
    PlotSetAxisLabels('$z~[mm]$','$C^{(n)}\,\, [a.u.]$',FontSize);
    PlotSetFigureDimensions(5,2,26,15,0,0,0,0);
    PlotSetAxisProperties(5,5,20);
    set(gca, 'Units', 'normalized','Position', [0.15 0.22 0.6 0.65]);
    set(gca, 'Color', 'none');
    if(setting.SaveFigure == true)
        export_fig(['PropagationCpump-Area' int2str(omega0pumpmicro*1e6) 'mumI' int2str(Pump.I0*1e-9) 'GW'], '-pdf', '-transparent');
    end
end

if(setting.Plot==true | any(setting.Plot==7))
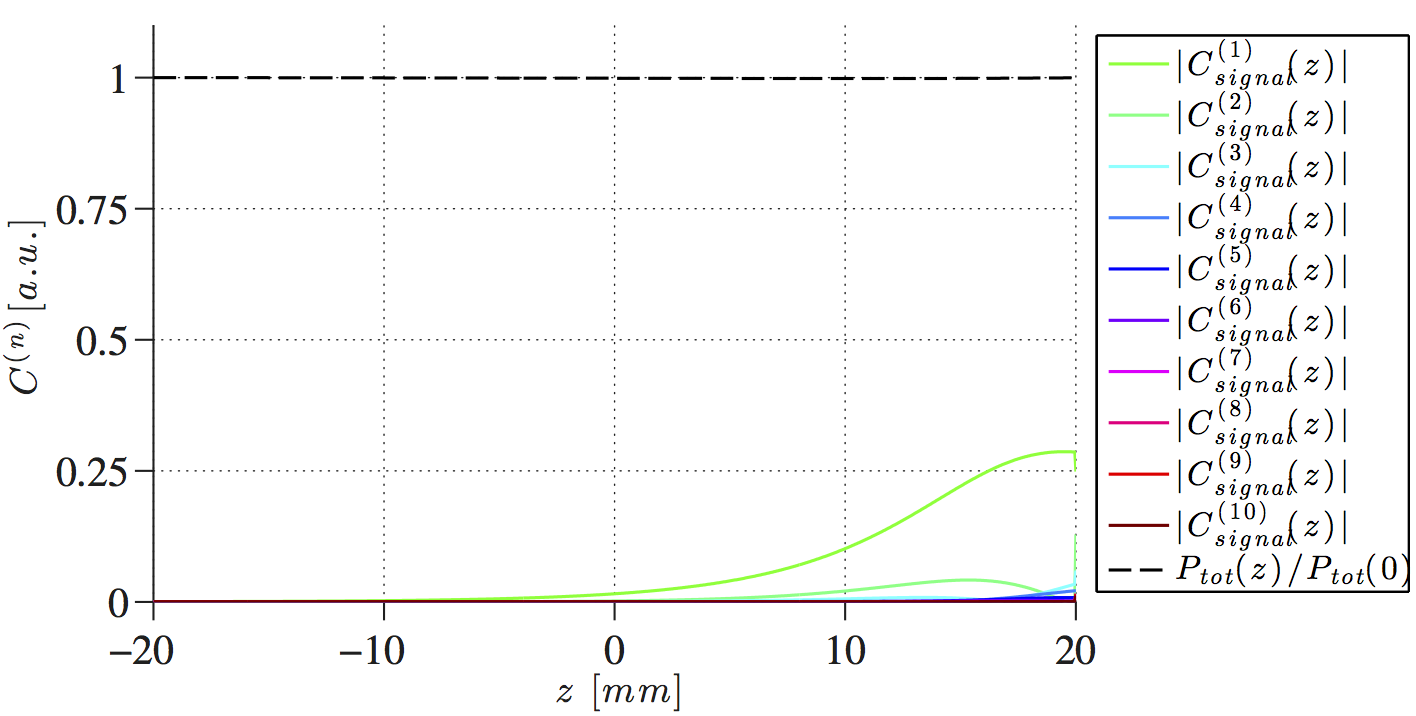
    figure(7)
    ColorSet=varycolor(Param.Lmax+1);
    legends7 = cell(1,Param.Lmax+1);
    hold on
    for l=1:Param.Lmax
        plot(zmili,abs(Signal.C(l,:))./abs(Pump.C(1,1)),'LineWidth',1.5,'Color',ColorSet(l,:));
        legends7{l} = ['$|C_{signal}^{(' num2str(l) ')}\,(z)|$'];
    end
        plot(zmili,Power(:)./Power(1),'--k','LineWidth',1.5,'Color',ColorSet(Param.Lmax+1,:));
        legends7{Param.Lmax+1} = '$P_{tot\,}(z)/P_{tot\,}(0)\,\,$';
        %test = sum((abs(Pump.n*Pump.C(:,:)).^2 + abs(Signal.n*Signal.C(:,:)).^2.)./(abs(Pump.n*Pump.C(1,1).^2)+abs(Signal.n*Signal.C(1,1).^2)),1);
        %plot(zmili,test,'LineWidth',1.5,'Color',ColorSet(Param.Lmax+2,:));
        %legends6{Param.Lmax+2} = '$C^2_{tot\,}(z)/C^2_{tot\,}(0)\,\,$';
    hold off;
    xlim([zmili(1) zmili(end)]);
    ylim([0 1.1]);
    l7 = legend(legends7,'Orientation','vertical','Location','EastOutside','FontSize',16);
    set(l7,'Interpreter','latex')
    PlotSetAxisLabels('$z~[mm]$','$C^{(n)}\,\, [a.u.]$',FontSize);
    PlotSetFigureDimensions(10,2,26,15,0,0,0,0);
    PlotSetAxisProperties(5,5,20);
    set(gca, 'Units', 'normalized','Position', [0.15 0.22 0.6 0.65]);
    set(gca, 'Color', 'none');
    if(setting.SaveFigure == true)
        export_fig(['PropagationCsignal-Area' int2str(omega0pumpmicro*1e6) 'mumI' int2str(Pump.I0*1e-9) 'GW'], '-pdf', '-transparent');
    end
end

if(setting.Plot==true | any(setting.Plot==8))
    figure(8)
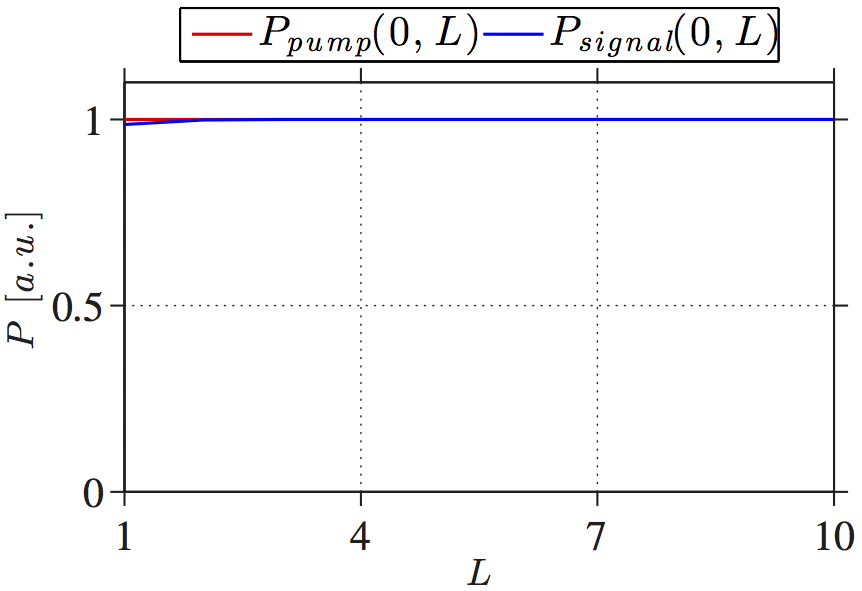
    p81 = plot(1:Param.Lmax,Pump.ModePower(:,floor(Param.zsteps/2)) ./ Pump.ModePower(end,floor(Param.zsteps/2)),'-r');
    hold on;
    p82 = plot(1:Param.Lmax,Signal.ModePower(:,floor(Param.zsteps/2)) ./ Signal.ModePower(end,floor(Param.zsteps/2)),'-b');
    hold off;
    set([p81 p82],'LineWidth',1.5);
    l8 = legend('$P_{pump\,\,}(0,L)$','$P_{signal\,\,}(0,L)$','Orientation','horisontal','Location','NorthOutside');
    set(l8,'Interpreter','latex')
    axis([1 Param.Lmax 0 1.1]);
    PlotSetAxisLabels('$L$','$P~[a.u.]$',FontSize);
    PlotSetFigureDimensions(12+12,2+10,16,11,0,0,0,0);
    PlotSetAxisProperties([1 4 7 10],3,20);
    set(gca, 'Units', 'normalized','Position', [0.18 0.22 0.75 0.63]);
    set(gca, 'Color', 'none'); % Sets axes background
    if(setting.SaveFigure == true)
        export_fig(['PropergationPowerModes-Area' int2str(omega0pumpmicro*1e6) 'mumI' int2str(Pump.I0*1e-9) 'GW'], '-pdf', '-transparent');
    end
end

if(setting.Plot==true | any(setting.Plot==9))
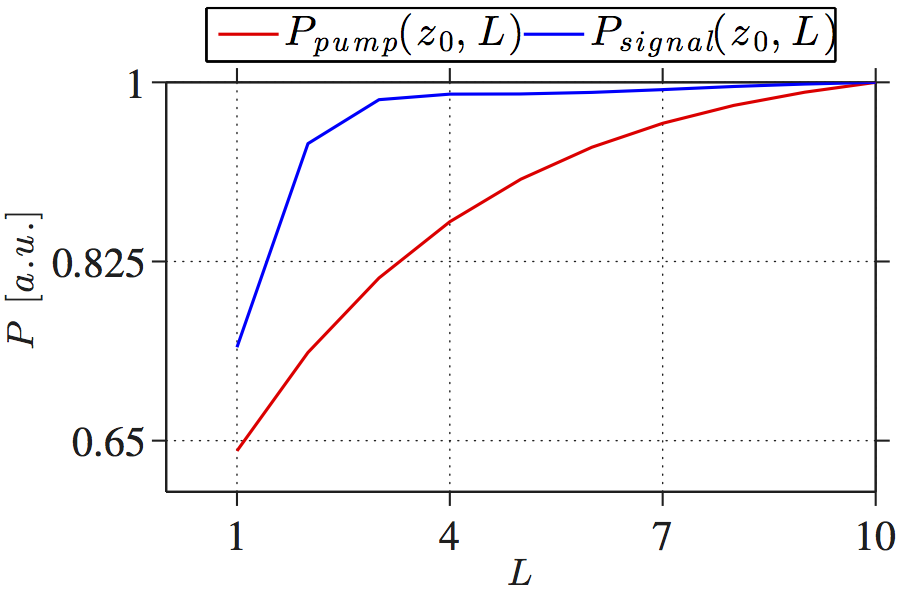
    figure(9)
    p91 = plot(1:Param.Lmax,Pump.ModePower(:,end) ./ Pump.ModePower(end,end),'-r');
    hold on;
    p92 = plot(1:Param.Lmax,Signal.ModePower(:,end) ./ Signal.ModePower(end,end),'-b');
    hold off;
    set([p91 p92],'LineWidth',1.5);
    l9 = legend('$P_{pump\,\,}(z_0,L)$','$P_{signal\,\,}(z_0,L)$','Orientation','horisontal','Location','NorthOutside');
    set(l9,'Interpreter','latex')
    %axis([1 Param.Lmax 0 1.1]);
    PlotSetAxisLabels('$L$','$P~[a.u.]$',FontSize);
    PlotSetFigureDimensions(12+12,2+10,16,11,0,0,0,0);
    PlotSetAxisProperties([1 4 7 10],3,20);
    set(gca, 'Units', 'normalized','Position', [0.18 0.22 0.75 0.63]);
    set(gca, 'Color', 'none'); % Sets axes background
    if(setting.SaveFigure == true)
        export_fig(['PropergationPowerModesZ0-Area' int2str(omega0pumpmicro*1e6) 'mumI' int2str(Pump.I0*1e-9) 'GW'], '-pdf', '-transparent');
    end
end

if(setting.Plot==true | any(setting.Plot==10))
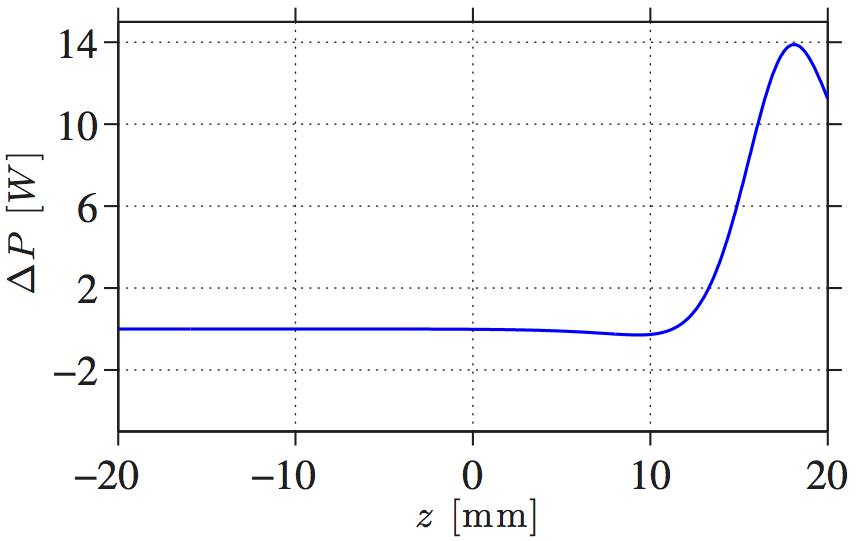
    figure(10)
    p101 = plot(zmili(2:end),PowerChange);
    set([p101],'LineWidth',1.5);
    %axis([1 Param.Lmax 0 1.1]);
    PlotSetAxisLabels('$z$ [mm]','$\Delta P~[W]$',FontSize);
    PlotSetFigureDimensions(12+12,2+10,16,11,0,0,0,0);
    PlotSetAxisProperties(5,5,20);
    set(gca, 'Units', 'normalized','Position', [0.18 0.22 0.75 0.63]);
    set(gca, 'Color', 'none'); % Sets axes background
    if(setting.SaveFigure == true)
        export_fig(['PropergationDeltaP-Area' int2str(omega0pumpmicro*1e6) 'mumI' int2str(Pump.I0*1e-9) 'GW'], '-pdf', '-transparent');
    end
end
if(setting.Plot==true | any(setting.Plot==11))
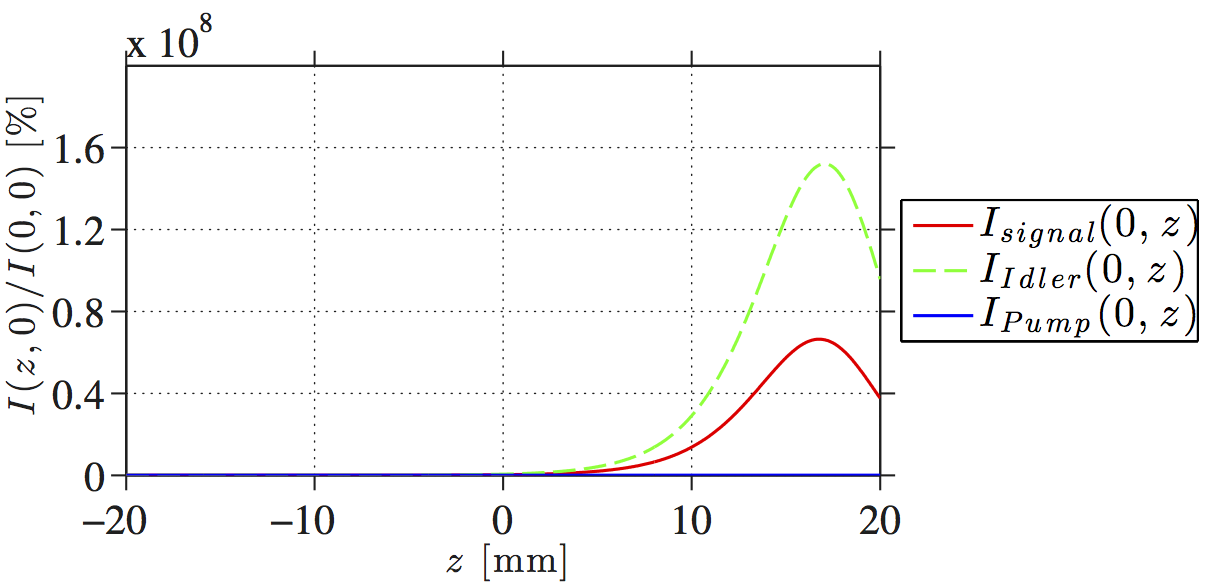
    figure(11)
    p111 = plot(zmili,Signal.Iplot(:,floor(size(Signal.Iplot,2)/2))./Signal.Iplot(1,floor(size(Signal.Iplot,2)/2)).*1e2,'r');
    hold on;
    p112 = plot(zmili,Idler.Iplot(:,floor(size(Idler.Iplot,2)/2))./Idler.Iplot(1,floor(size(Idler.Iplot,2)/2)).*1e2,'--g');
    p113 = plot(zmili,Pump.Iplot(:,floor(size(Pump.Iplot,2)/2))./Pump.Iplot(1,floor(size(Pump.Iplot,2)/2)).*1e2,'b');
    hold off;
    set([p111 p112 p113],'LineWidth',1.5);
    l11 = legend('$I_{signal}\,\,(0,z)$','$I_{Idler}\,\,(0,z)$','$I_{Pump}\,\,(0,z)$','Orientation','vertical','Location','EastOutside');
    set(l11,'Interpreter','latex')
    xlim([zmili(1) zmili(end)])% 0 max(Pump.Iplot(:,floor(size(Pump.Iplot,2)/2))).*1e-9]);
    PlotSetAxisLabels('$z$ [mm]','$I(z,0)/I(0,0)~[\%]$',FontSize);
    PlotSetFigureDimensions(5,10,22,11,0,0,0,0);
    PlotSetAxisProperties(5,5,20);
    set(gca, 'Units', 'normalized','Position', [0.15 0.22 0.58 0.63]);
    set(gca, 'Color', 'none'); % Sets axes background
    if(setting.SaveFigure == true)
        export_fig(['PropergationOnAxis-Area' int2str(omega0pumpmicro*1e6) 'mumI' int2str(Pump.I0*1e-9) 'GW'], '-pdf', '-transparent');
    end
end
if(setting.Plot==true | any(setting.Plot==12))
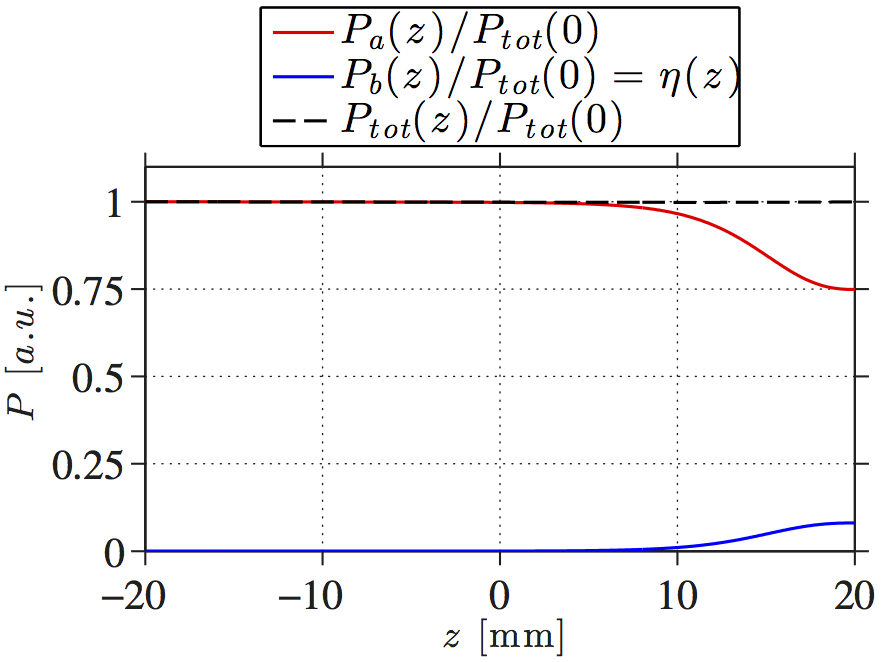
    figure(12)
    p121 = plot(zmili,Pump.Power./Power(1),'-r');
    hold on;
    p122 = plot(zmili,Signal.Power./Power(1),'-b');
    p123 = plot(zmili,Power./Power(1),'--k');
    hold off;
    ylim([0 1.1]);
    set([p121 p122 p123],'LineWidth',1.5);
    l12 = legend('$P_a(z)/P_{tot\,}(0)$','$P_b(z)/P_{tot\,}(0)=\eta (z)\,\,\,$','$P_{tot\,}(z)/P_{tot\,}(0)$','Orientation','vertical','Location','NorthOutside');
    set(l12,'Interpreter','latex')
    PlotSetAxisLabels('$z$ [mm]','$P~[a.u.]$',FontSize);
    PlotSetFigureDimensions(12+12,2+10,16,13,0,0,0,0);
    PlotSetAxisProperties(5,5,20);
    set(gca, 'Units', 'normalized','Position', [0.18 0.22 0.75 0.50]);
    set(gca, 'Color', 'none'); % Sets axes background
    if(setting.SaveFigure == true)
        export_fig(['PropergationPowerZ-Area' int2str(omega0pumpmicro*1e6) 'mumI' int2str(Pump.I0*1e-9) 'GW'], '-pdf', '-transparent');
    end
end

disp(['Time spend making figures: ' sprintf('%0.2f',toc(ticPlot)) '(' sprintf('%0.2f',toc(ticAll)) ')']);
Time spend making figures: 88.97(1242.08)
Create movie
ticVideo = tic;
if(setting.Movie==true)
    f11 = figure(11);
    movegui(f11, 'onscreen');
    rect = get(f11,'Position');
    rect(1:2) = [0 0];
    writerObj = VideoWriter(['Video-',datestr(now, 'yyyy-mm-dd-HH-MM-SS'),'.avi']);
    writerObj.FrameRate = 15;
    open(writerObj);
    for countj=1:30:Param.zsteps
        p111 = plot(raxis,abs(Signal.Iplot(countj,:)),'-b');
        hold on;
        p112 = plot(raxis,abs(Pump.Iplot(countj,:)),'-r');
        p113 = arrow([raxis(Pump.FWHM(countj,2)) Pump.Iplot(countj,Pump.FWHM(countj,2))],[raxis(Pump.FWHM(countj,3)) Pump.Iplot(countj,Pump.FWHM(countj,3))]);
        p114 = arrow([raxis(Pump.FWHM(countj,3)) Pump.Iplot(countj,Pump.FWHM(countj,3))],[raxis(Pump.FWHM(countj,2)) Pump.Iplot(countj,Pump.FWHM(countj,2))]);
        hold off;
        set([p111 p112],'LineWidth',1.5);
        l11 = legend('$I_b(r,z)$','$I_a(r,z)$','Orientation','vertical','Location','EastOutside');
        set(l11,'Interpreter','latex')
        axis([raxis(1) raxis(end) 0 2.5e11]);
        title([sprintf('z = %6.4f',z(countj)*1e3) 'mm']);
        writeVideo(writerObj,getframe(gcf,rect));
    end
    close(writerObj);
end
disp(['Time spend making video: ' sprintf('%0.2f',toc(ticVideo)) '(' sprintf('%0.2f',toc(ticAll)) ')']);
Time spend making video: 0.00(1243.43)